Description
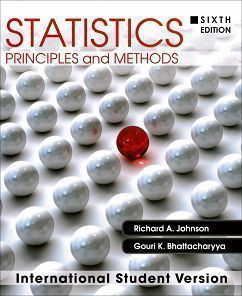
Johnson/Bhattacharyya is unique in its clarity of exposition while maintaining the mathematical correctness of its explanations. Many other books that claim to be easier to understand often sacrifice mathematical rigor. In contrast, Johnson/ Bhattacharyya maintains a focus on accuracy without getting bogged down in unnecessary details.
This highly regarded text provides a wide range of contemporary applications in its examples and exercises to ensure that all students will find something they can relate to and which will motivate them. The book is used in mathematics, statistics, biology, and engineering departments as an introductory text.
Features
Crucial elements are boxed to highlight important concepts and methods essential for learning statistics. At the end of each chapter, all of its key ideas and formulas are summarized.
A rich collection of examples and exercises is included. These are drawn from a large variety of real-life settings. In fact, many data sets stem from genuine experiments, surveys, or reports.
Using Statistics Wisely are important guidelines for using statistics now appear at the end of each chapter.
Technology: At the end of most chapters are step-by-step directions for using MINITAB, EXCEL, and the TI-84 calculator. This concentrates the presentation of special purpose instructions so that, with few exceptions, only computer output is needed in the text.
Regression analysis is a primary statistical technique so Johnson/Bhattacharyya provides a more thorough coverage of this topic than is usual at this level. The basics of regression are introduced in Chapter 11 and in Chapter 12 this discussion is expanded to methods of model checking, handling nonlinear relations, and multiple regression analysis. Complex formulas and calculations are judiciously replaced by computer output so main ideas can be easily learned and appreciated by students.
Computer Aided Statistical Analyses use software packages that can remove much of the drudgery of hand calculation and plotting. They allow students to work with larger data sets, where patterns are more pronounced, and make complicated calculations. In addition to the discussion of some computer output in the text, computer exercises are included in all chapters where relevant.
A Convenient Data Bank at the end of the book contains a substantial collection of data. These data sets, together with numerous others throughout the book, allow for considerable flexibility in the choice between concept-oriented and applications-oriented exercises. The Data Bank and the other larger data sets can be downloaded from the book’s Web site.
New to This Edition
Technical Appendix A presents a few statistical topics of a mathematical nature. New material on counting rules has been added.
Section 4.6 on Bayes’ Theorem has been added
New sections have been added to chapter 10: 10.3, Large Samples Inference about Difference of Two Means; 10.4, Inferences from Small Samples: Normal Populations with Equal Variances; 10.5, Inferences from Small Samples: Normal Populations but Unequal Variances
Applications have been updated and many new ones have been added.
Table of Contents
1. Introduction
2. Organization and Description of Data
3. Descriptive Study of Bivariate Data
4. Probability
5. Probability Distributions
6. The Normal Distribution
7. Variation in Repeated Samples-Sampling Distribution
8. Drawing Inferences From Large Samples
9. Small-Sample Inferences for Normal Populations
10. Comparing Two Treatments
11. Regression Analysis I
12. Regression Analysis- II
13. Analysis of Categorical Data
14. Analysis of Variance (ANOVA)