書籍分類
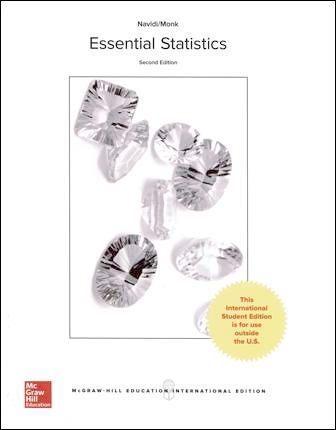
Essential Statistics 2/e
作者:William Navidi, Barry Monk
原價:NT$ 1,200
ISBN:9781260083699
版次:2
年份:2018
出版商:McGraw-Hill
頁數/規格:616頁/平裝彩色
版次:2
年份:2018
出版商:McGraw-Hill
頁數/規格:616頁/平裝彩色
內容介紹 本書特色 目錄 作者介紹
- Description
This book is designed for an introductory course in statistics. The mathematical prerequisite is basic algebra. in addition to presenting the mechanics of the subject. we have endeavored to explain the concepts behind them in a writing style as straightforward, clear, and engaging as we could make it. As practicing statisticians, we have done everything possible to ensure that the material is accurate and correct. We believe that this book will enable instructors to explore statistical concepts in depth yet remain easy for students to read and understand.
- To achieve this goal, we have incorporated a number of useful pedagogical features:
- Check Your Understanding Exercise: After each concept is explained, one or more exercises are immediately provided for students to be sure they are following the material. These exercises provide students with confidence that they are ready to go on, or alert them to the need to review the material just covered.
- Explain It Again: many important concepts are reinforced with additional explanation in these marginal notes.
- Real Data: Statistics instructors universally agee that the use of real data engages students and convinces them of the usefulness of the subject Agreat many of the examples and exercises use real data. Some data sets explore topics in health for social sciences, while others are based in popular culture such as movies, contemporary music, or video games.
- Integration of Technology: Many examples contain screenshots from the TI-84 Plus calculator, MINITAB, and Excel. Each section contains detailed, step-by-step instructions, where applicable, explaining how to use these forms of technology to carry out the procedures explained in the text.
- Interpreting Technology: Many exercises present output from technology and require the student to interpret the results.
- Write About It: These exercises, found at the end of each chapter, require students to explain statistical concepts in their own words.
- Case Studies: Each chapter begins with a discussion of a real problem. At the end of the chapter, a case study demonstrates applications of chapter concepts to the problem.
- The second edition of the book is intended to extend the strengths of the first. Some of the changes are:
- The material introducing the normal distribution has been rewritten to make it equally accessible for those using tables or technology.
- The material on percentiles and quantiles has been rewritten to make it easier for those who wish to cover quantiles without covering percentiles.
- A large number of new exercises have been included, many of which involve real data from recent sources.
- Several of the case studies have been updated.
- The exposition has been improved in a number of places.
Flexibility
We have endeavored to make our book flexible enough to work effectively with a wide variety of instructor styles and preferences. We cover both the P-value and critical value approaches to hypothesis testing, so instructors can choose to cover either or both of these methods.
Instructors differ in their preferences regarding the depth of coverage of probability. A light treatment of the subject may be obtained by covering Section 4.1 and skipping the rest of the chapter. More depth can be obtained by covering Section4.2.
New in This Edition
- Table of Contents
Chapter 1: Basic Ideas
Chapter 2: Graphical Summaries of Data
Chapter 3: Numerical Summaries of Data
Chapter 4: Probability
Chapter 5: Discrete Probability Distributions
Chapter 6: The Normal Distribution
Chapter 7: Confidence Intervals
Chapter 8: Hypothesis Testing
Chapter 9: Inferences on Two Samples
Chapter 10: Tests with Qualitative Data
Chapter 11: Correlation and Regression
- William Navidi
William Navidi is Professor of Mathematical and Computer Sciences at the Colorado School of Mines. He received the B.A. degree in mathematics from New College, the M.A. in mathematics from Michigan State University, and the Ph.D. in statistics from the University of California at Berkeley. Professor Navidi has authored more than 50 research papers both in statistical theory and in a wide variety of applications including computer networks, epidemiology, molecular biology, chemical engineering, and geophysics.
Barry Monk
Degrees: Bachelor of science in applied mathematics, University of Alabama; master of arts in mathematics, University of Alabama; and doctorate in applied mathematics, University of Alabama.
Year he joined the Macon State faculty: 2001.
Some of his professional career highlights are … “Being asked to serve as the program coordinator of mathematics after only two years at Macon State College, heading up the development of the bachelor’s degree in mathematics at Macon State, leading the organization of the Southeastern Scholarship Conference on E-Learning hosted by Macon State each year since 2005, maintaining high student evaluations and developing numerous online mathematics courses with my colleagues Mary Wolfe, Steve Davis and Wanda Eanes.”
He enjoys teaching at Macon State because … “I am surrounded by a great group of people – both students and faculty.”
His favorite course to teach is… “Calculus, because there are so many interesting applications that can be covered. Also, this is the course where students really start to see how the different areas of mathematics come together.”
One thing people don’t know about Macon State is … “How dedicated the faculty are to the success of students.”
One thing people don’t know about him is … “I worked my way through college playing jazz piano in a bar.”
In his spare time he likes to … “Read, compose music, bowl, play with my six cats and go shopping. I also like to travel a lot.”
The one person he’d most like to meet is … “The Amazing James Randi, because of his tireless work promoting science, freethinking and critical reasoning skills.”
If he wasn’t a college professor he would be . . . “Who knows? Maybe a blackjack dealer at a high-stakes table in Las Vegas.”


